Exoplanet Transit
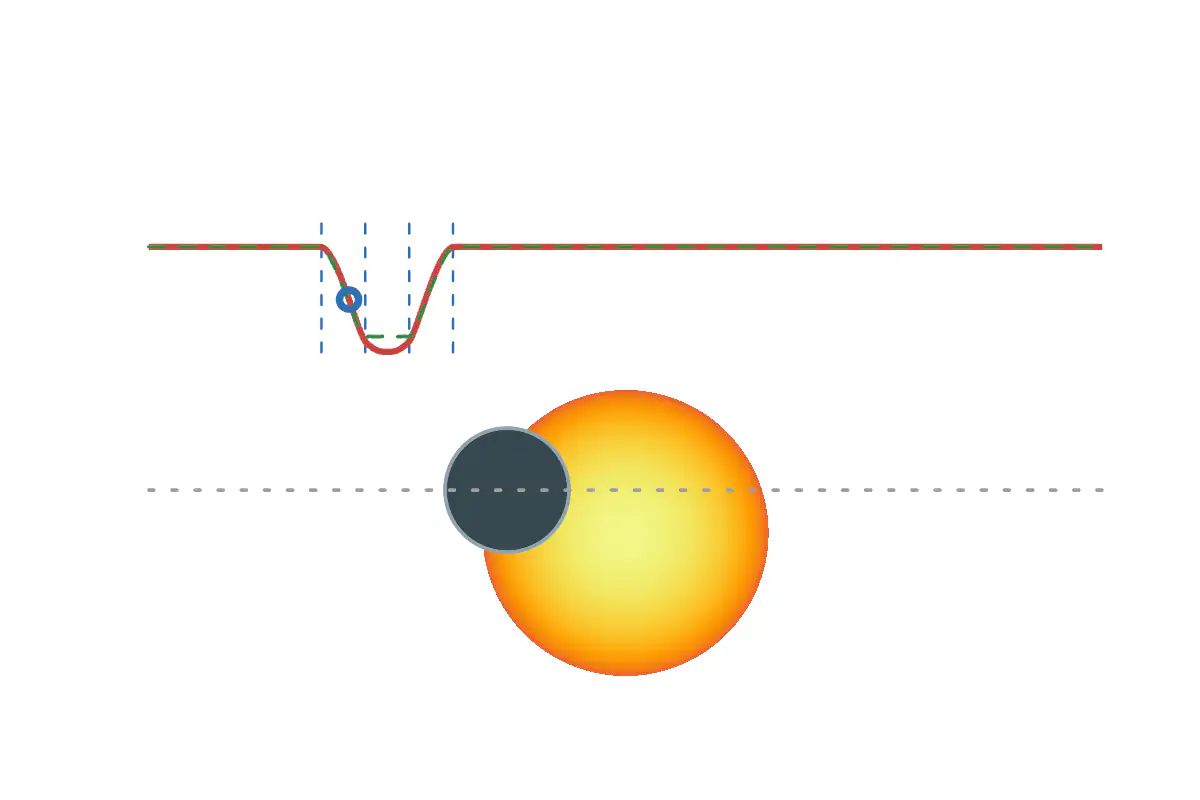
A planet crossing its limb-darkened star, with the light curve an observer would record: a flat-bottomed dip for a uniform disc, a rounded, deeper one for the real star.
Most known exoplanets were found by the transit method: when a planet passes in front of its star, the star's light dims by a small amount for a few hours, and a plot of brightness against time, the light curve, shows a dip. Its depth gives the ratio of the planet's area to the star's; its duration and shape give the orbit's size and how far off-center the planet crosses. Below the light curve, this document shows the system edge-on. The planet moves along the dotted orbit line with a period P , in front of the star for the first half of the cycle and behind it, drawn pale, for the second. The impact parameter b sets how far above the star's center the crossing runs, in stellar radii.
The star is drawn with limb darkening: its disc is brightest at the center and fades toward the edge, following I(w) = 1 - k(1 - \sqrt{1 - w^2}) at the fractional radius w , with k = 0.6 as for visible light. That is why the two light curves differ. The dashed green curve treats the star as a uniformly bright disc, so the blocked light is simply the blocked area and the dip has a flat bottom between second and third contact. The solid red curve weights each blocked ring of the star by its brightness: as the planet moves over the bright center it blocks more light than its area alone would, so the dip is deeper and rounded, as real light curves are. Both come from the same ring sum B(s, j) , which adds up, ring by ring, the angle S(w, s) the planet subtends on the ring, times the ring's brightness for a darkening coefficient j . The four dashed blue lines mark the contacts, where the planet's disc touches the star's limb from outside and from inside. The time T animates through one orbit; the ring on the solid curve marks the current brightness. The radii and the period are illustrative, not realistic.
After a Desmos graph by Steve Stonebraker.
JavaScript is required to view the interactive plot.