CIE Chromaticity Diagram
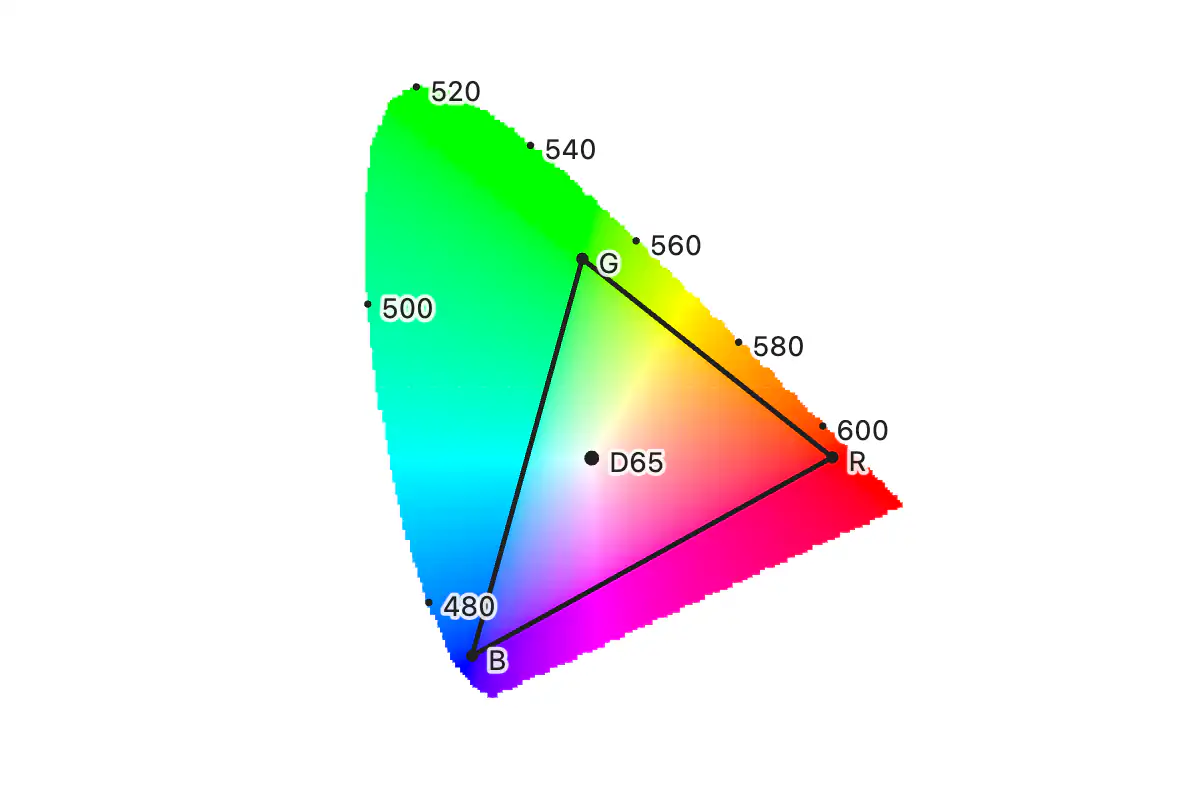
The horseshoe of all visible colors, each point painted with the sRGB color of its chromaticity by a color formula, with the sRGB gamut triangle inside it.
The CIE 1931 chromaticity diagram is the map of every color the human eye can see, with brightness removed. A color's tristimulus values X , Y , Z are normalized to x = X/(X+Y+Z) and y = Y/(X+Y+Z) , and the pair (x, y) is its chromaticity. The curved edge of the horseshoe is the spectral locus: the chromaticities of pure monochromatic light, labelled here in nanometres from 480 (blue) around to 600 (orange-red). The straight bottom edge is the line of purples, mixtures of the two ends of the spectrum that no single wavelength can produce. Every real color lies inside, because every light is a mixture of wavelengths.
The color of each point is a formula, not a palette: the point's chromaticity is converted back to tristimulus values at Y = 1 , then to linear sRGB with the standard matrix, and the three channels are divided by the largest of them, so every point is shown at the brightest level a display can give it; a negative channel, a color outside the sRGB gamut, is clipped to zero. The result then goes through the sRGB transfer curve and becomes \operatorname{rgb}(r, g, b) . The horseshoe itself is S(x, y) \ge 0 , where S is the smallest of 18 signed distances to the edges of a convex polygon inscribed in the spectral locus (CIE 1931 2° observer, sampled every 5 nm), so the formula is undefined, and nothing is painted, outside it. The colors are exact inside the sRGB triangle and clipped outside it: no display can reproduce the saturated colors near the edge.
The sRGB matrix assumes a D65 white, (x_w, y_w) = (0.3127, 0.3290) . The white point is a point you can drag: the conversion scales X and Z so that the dragged chromaticity maps to pure white (chromatic adaptation by scaling in XYZ , the simplest von Kries form), and every other color shifts with it. The D65 marker stays where D65 is.
The triangle is the sRGB gamut, the colors a standard display can show, with vertices at its red, green and blue primaries R = (0.64, 0.33) , G = (0.30, 0.60) and B = (0.15, 0.06) . Everything between the triangle and the horseshoe is a real color that an sRGB screen cannot produce; a straight line through two points holds every mixture of those two lights, which is why the gamut of any three primaries is a triangle and can never cover the curved locus.
JavaScript is required to view the interactive plot.